
In a recent newsletter, we set out Schrödinger’s Car, drawing a parallel with the famous Schrödinger’s Cat thought experiment, where a cat in a box is both dead and alive until the box is opened. Schrödinger’s Car is a vehicle that has high and low carbon dioxide (CO2) emissions until the occasion that it is driven, which describes the current situation with plug-in hybrid vehicles (PHEVs). In the best case, they could be cleaner than pure battery electric vehicles (BEVs), in the worst case higher emitting than standard internal combustion engines (ICEs), and on current behaviour no better than non-plug-in full hybrids (FHEVs) – all on a lifecycle analysis basis.
The conclusion was that PHEVs are too risky to allow into the market in any volumes, unless strong incentive mechanisms are put in place for drivers to charge them up regularly and employ them only on duty cycles that can be conducted mostly on battery. In some European countries, there are in fact positive incentives not to charge PHEVs, for example for company car drivers that get reimbursed for fuel spending but not additional domestic electricity consumption.
Emissions Analytics has tested 37 PHEVs in Europe and US using its standardised EQUA Index test protocol. The average CO2 emissions on the European PHEV vehicles tested are 115g/km, based on the typical proportion of miles driven on battery discussed below. This compares to an average on the official ratings of 58g/km, based on the Worldwide Harmonised Light Vehicle Test Procedure (WLTP) – so, real-world emissions are almost exactly double.

If these excessive CO2 emissions were not problematic enough in themselves, this situation is creating significant, but somewhat covert, subsidies of PHEVs in Europe and the UK through the fleet average CO2 target system and consumer incentives. As set out below, the annual subsidy across Europe may well be above €6bn already. However, this could rise steeply in a particular scenario that BEV take-up is slower than expected and manufacturers need to sell PHEVs in volume as they struggle to meet their ever-tightening fleet average CO2 targets through to 2030 and beyond. In contrast, if BEV penetration rises rapidly, the scenario set out below will not hold, as CO2 targets will easily be met, and PHEVs will be a brief transitional technology. In the more pessimistic scenario, where manufacturers rely heavily on PHEVs to meet CO2 targets, cumulative subsidy could add up to €475bn by 2035 – more than all motor-vehicle-related taxes paid each year in Europe1.
To illustrate this, a selection of three European PHEVs were taken, and each were paired with the nearest equivalent ICE vehicle. The official details are shown in the table below.

In a recent report, the International Council on Clean Transportation (ICCT) estimated the proportion of miles travelled on battery by PHEVs in Europe currently at around 37%2. This factor can be used to weight zero-CO2 battery operation with engine-only CO2 approximated by the WLTP of the equivalent ICE vehicle to yield a 'simulated' WLTP for the PHEV, as shown in the following table. This can be compared to the actual test values from the EQUA Index tests, weighted in the same way. Conversely, it is possible to estimate what proportion of driving would need to be on the battery for the NEDC and WLTP official test values to accord with actual practice.
Overall, EQUA Index CO2 results were only 4% higher than the simulated WLTP values. Whether considering the NEDC or WLTP, approximately 80% of driving must be on battery for the official CO2 values to be a meaningful representation of current driving, which is more than double the current reality.
This matters because of how it interacts with the Europe-wide fleet average CO2 targets. Averaging the emissions of new vehicles sold, each manufacturer must not exceed a threshold which is currently around 95g/km (the exact figure being tailored to each company, based on their mix of vehicle types), but which reduces over time. For each g/km above the limit, the manufacturer is fined £85 (€95) multiplied by the number of units sold. Below the limit, the manufacturer can effectively sell its surplus to a rival that is above the limit, thereby reducing the fine paid by that latter manufacturer by the same £85.
Taking the sample of three vehicles above, the simulated WLTP average is 114g/km compared to the official values of 35g/km, a difference of 79g/km. Alongside this, until 2022, the fleet average targets include ‘supercredits’, which allow each vehicle with official CO2 below 50g/km to count as 1.67 vehicles sold in the manufacturer’s overall fleet calculation. Therefore, the value of the difference in CO2 emissions is currently magnified, as shown in the table below.
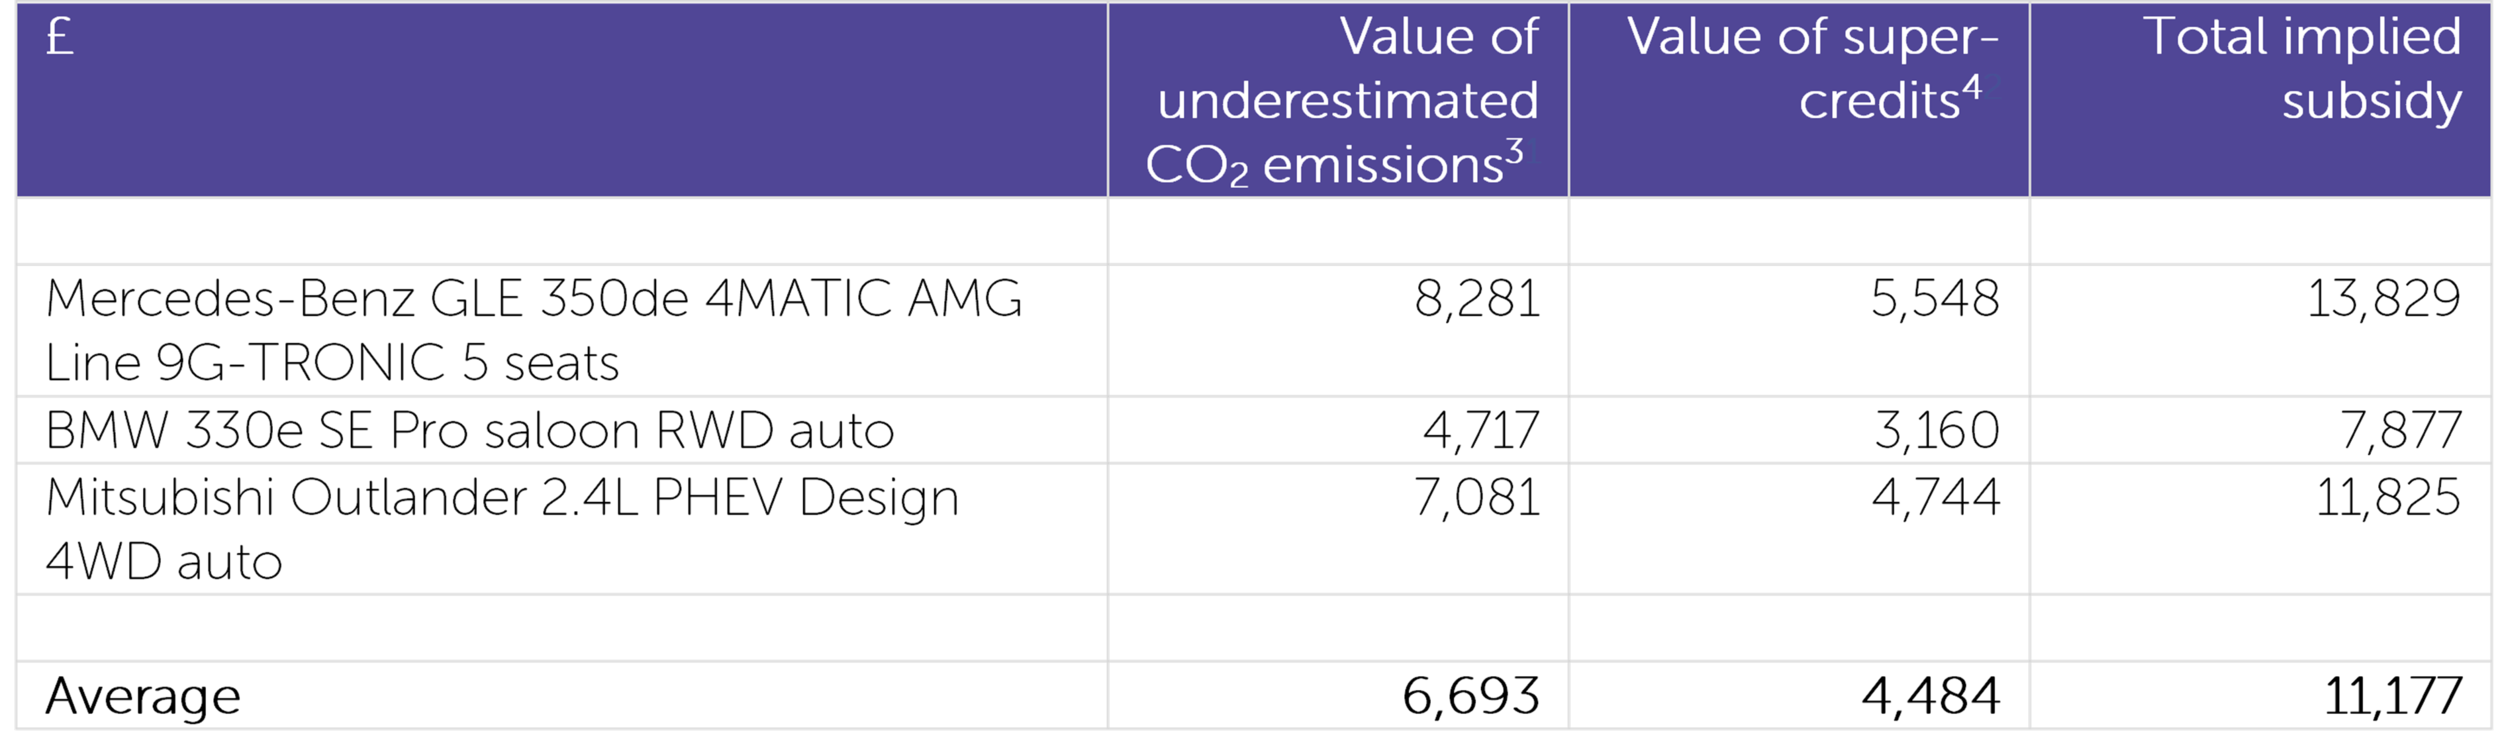
In other words, by having artificially low CO2 values, manufacturers enjoy a significant subsidy from the European taxpayer of over £11,000 (€12,100) per unit. This is equivalent to 24% of the list price. As these vehicles are typically profitable to make, unlike most pure battery electric vehicles, it is not surprising that a large number of new models are being brought to market.
In 2020, around half a million PHEVs were sold in Europe. This would imply a total subsidy of over £5.5bn (€6.1bn). Projections for PHEV sales in 2030 vary widely, from below 10% by Deloitte to as much as 50%. Assuming total sales of all powertrains of 15m vehicles in 2030, this implies a total potential subsidy in that year of between £10bn (€11bn) and £50bn (€55bn), factoring in the phase out of supercredits.
If we take the mid-point of these 2030 scenarios, PHEV market share grows in a linear way up until then, and is constant after that until 2035, the cumulative subsidy would be a not inconsiderable one-third of a trillion Euros. This is more than half the annual gross domestic product of Bavaria.
But this is does not cover all the subsidies available for PHEVs. Many European countries incentivise their purchase, through a combination of retail subsidies, annual car tax reduction and benefit-in-kind income tax reduction for cars provided to employees by their company. The type and magnitude of these subsidies vary significantly between countries, but we can take the UK as an example.
The source of the subsidy is the same as with the fleet average CO2 targets: artificially low official CO2 figures. It is the prerogative of governments to offer subsidies to consumers, but this is being done in a covert manner, and does not align with the true environmental effects of these vehicles. In the UK, the subsidy is channelled through company car benefit-in-kind tax and annual road duty. While the latter applies across the market, company cars – including schemes such as ‘salary sacrifice’ – account for only around 15% of the market5.
The table below shows the implied value of the underestimation of CO2 emissions – how much less consumers pay than they 'should'. The final column weights the company car subsidy by the 15% market share to get a representative value for the whole market.
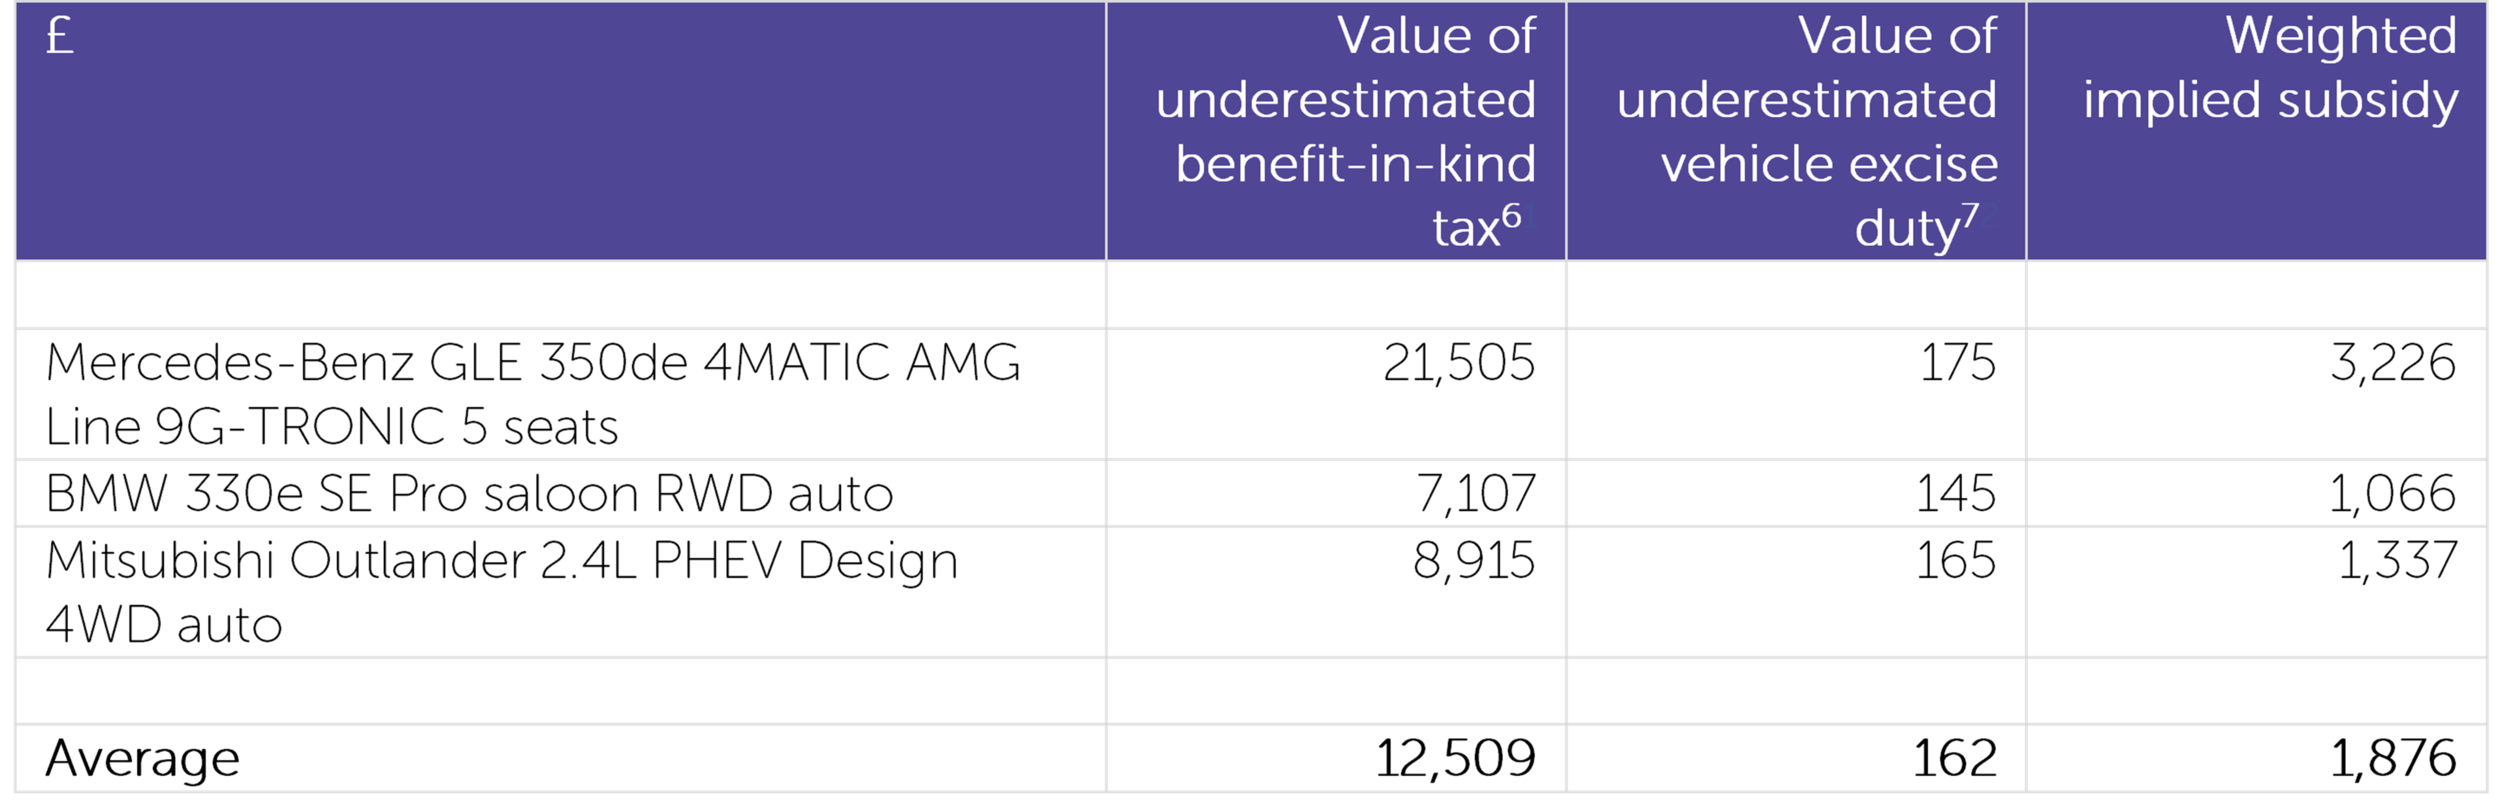
The subsidy to a company car driver over a three-year period is £12,671 (€13,938). On top of the manufacturer subsidy, this is 52% of the average vehicle list price. Across the whole UK market, weighting the company cars at 15% of the total market, the average consumer subsidy is over £1,800 (€1,980). Combining this with the manufacturer subsidy, the total subsidy is £13,053 (€14,358) per unit, or 28% of list price.
Taking this value, together with the same market share projections through to 2035 as above, the total subsidy would be €475bn – almost the same as the gross domestic product of Baden-Württemberg. Of course, this relies on the scenario that PHEVs are the swing factor for manufacturers in meeting or not meeting their future CO2 targets, which may not be the case if BEV penetration accelerates.
It should also be noted that the levels and terms of these taxes and duties are subject to change by governments at relatively short notice, and they differ between each country in Europe. Whether the overall level of support from governments is increased or decreased is unpredictable. In contrast, there is greater future visibility on the fleet average CO2 system.
Ultimately, the amount of taxpayers’ money dispensed, the trajectory of climate change and the structure of the automotive industry rides on whether Schrödinger’s Car, like the Cat, lives. Unless the right incentives are put in place around both original purchase for the right use cases, and after purchase to encourage charging the vehicles, PHEVs should have all subsidy removed immediately. With the current propensity for owners to charge their PHEVs, the CO2 emissions are no better than traditional hybrids, which do not attract the same subsidies, and which put much less pressure on the battery material supply chain.
Footnotes:
ACEA (European Automobile Manufacturers’ Association), https://www.acea.be/press-releases/article/motor-vehicle-taxation-brings-in-440.4-billion-for-governments-in-major-eur
Real-world usage of plug-in hybrid electric vehicles, International Council on Clean Transportation/Fraunhofer Institute for Systems and Innovation Research ISI, September 2020
Difference between simulated CO2 and NEDC, multiplied by £85 (€95) as the market price of carbon, applied only in year of purchase
Supercredits as defined under fleet average CO2 system – assuming x1.67 for a sale in 2021
According to HMRC, there are 870,000 company car drivers in total (https://www.fleetnews.co.uk/news/fleet-industry-news/2020/09/30/hmrc-data-shows-30-000-fewer-company-cars) and a vehicle may be held for an average of three years, yielding 290,000 purchases per year, which is approximately 15% of the 2m annual UK car market
Assuming 40% higher-rate tax payer, multiplied by 10% company car share of market over three-year period and 13.8% employer National Insurance
Annual vehicle road tax, based on CO2 emissions over three years