

Average fuel economy has fallen for the first time since Emissions Analytics began its real-world test programme in 2011. Not only that but the ‘gap’ between official figures and our results did not widen last year. The reason for this appears to be intrinsically linked to the introduction of the Euro 6 emissions standards. This newsletter looks to explain what our data is showing and what this means for fuel economy and CO2 targets in the future.
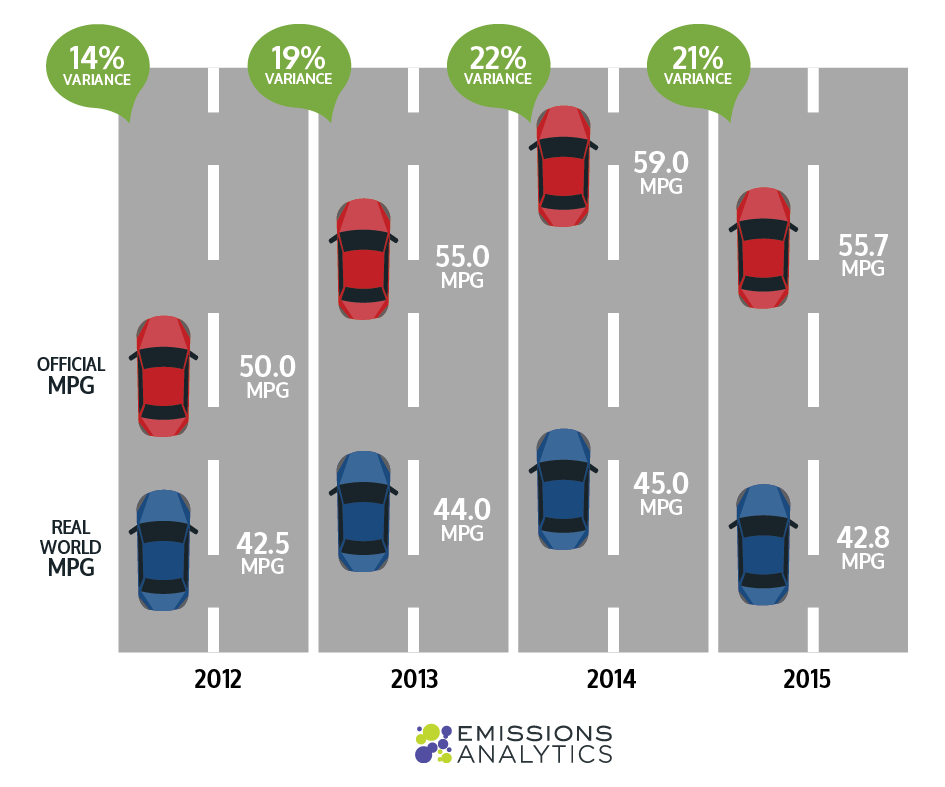
Evident in our recently published infographic, pictured above, fuel economy has dropped by 3.3 mpg in 2015 and the ‘gap’ has shrunk slightly from 21.5% in 2014 to 21.3% in 2015.
The explanation for this change is due to two main factors, around the mix of vehicles tested and the typical performance of the latest diesel engines. As Emissions Analytics tests vehicles around the time they are launched, there is inevitable fluctuation in the types tested, and hence the mix. This was made more notable with the introduction of the Euro 6 emissions regulations for all new vehicles sold from September 2015.
In the run-up to this deadline, the last of the Euro 5 vehicles had a strong bias towards larger, more powerful vehicles, with lower fuel economy. Perhaps manufacturers were concentrating on releasing the Euro 6 versions of their high volume models first, leaving compliance for the lower-selling or harder-to-comply models until the end of the Euro 5 window.
At the same time as this mix effect, 2015 also saw a reduction in the average fuel economy of the Euro 6 diesel cars tested. These were on average 5.4% less fuel efficient than the Euro 6 diesels tested in 2014. This is likely to be due to some combination of the mix of makes and models launched and in many cases the additional fuel requirement of the NOx abatement systems. In contrast, Euro 6 petrol vehicles tested in 2015 saw a 5.8% improvement in fuel economy compared to those tested in 2014 – these vehicles did not have extra NOx after-treatment systems.
This led us to look at whether the conformity factor (ratio of emissions in real-world driving to the regulated emissions level) for Euro 6 NOx was improving over time and what we found was:
Year Conformity Factor
2013 6.7
2014 2.7
2015 3.5
In 2013 we tested just five Euro 6 models, all early adopters of the new technology, which had showed a high average NOx conformity factor, and also a wide spread. In 2014, it appears that well-placed manufacturers brought mainstream Euro 6 models to market with low conformity factors averaging just 2.7. By 1 September 2015, all models had to be Euro 6 compliant, so included model less well optimised after-treatment systems, perhaps driving the average conformity factor back up.
What can also be seen, however, is that the recently upheld Real Driving Emissions NOx Conformity Factor of 2.1 from 2017 is readily achievable for many, with 29% of models already meeting this level in real-world driving, according to Emissions Analytics’ database.