

But which ones really matter on the road?
When the various pandemic lockdowns across Europe failed to bring about the overall improvements in air quality that might have been expected, Emissions Analytics’ interest focused in on volatile organic compounds (VOCs) and their potential role. While nitrogen oxide (NOx) emissions fell with traffic levels, often ground-level ozone (O³) rose, leading to similarly bad air quality from a human health point of view, just of a slightly different complexion. In fact, this should not have been a surprise as the complex interaction of NOx, VOCs and O³ has long been studied¹. The South Bay in Los Angeles has grappled with this problem since motor vehicles proliferated, and many US air quality regulations have stemmed from the experiences there.

Recent newsletters from Emissions Analytics have, therefore, looked at sources of VOCs including vehicle tyres (What's in a tyre?) and materials (Euro 8: Rethinking Vehicle Emissions Fundamentally). This newsletter returns to the tailpipe to see what VOCs and other currently unregulated pollutants are being emitted in real-world, on-road driving. This is aimed at taking understanding beyond the ‘total hydrocarbons’ that are regulated using a laboratory test in Europe, and non-methane hydrocarbons that are regulated in a number of territories including the US. This research is being conducted against the backdrop of the current discussions around the proposed new ‘Euro 7’ regulation, which may include some hitherto ignored pollutants including particular species of VOCs.
Measuring a wide range of organic compounds and other volatile species at the tailpipe is a challenge due to the large number of different compounds – many hundreds, if not thousands – as well as their volatility, which can make them hard to capture. While this can be done in the laboratory, it is an even greater challenge on the road. Traditional portable emissions measurement systems (PEMS) measure total hydrocarbons (THC) using a flame ionisation detector (FID). This can deliver robust measurements, but it creates some operational challenges, not least from the need for a supply of combustion gas. Furthermore, only a single figure for total hydrocarbons is produced; it does not include non-hydrocarbon VOCs and does not separate the different species of hydrocarbons.

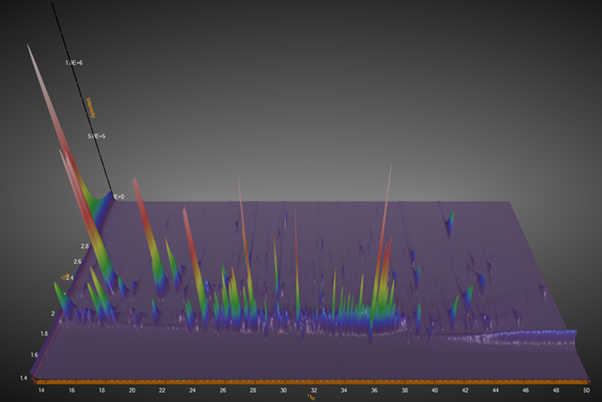
To address these challenges and limitations, Emissions Analytics has developed a proprietary, patent-pending system, that harnesses sample collection from the exhaust onto tubes while driving, which are then analysed later using laboratory gas chromatography. Using this, we can measure the concentrations of VOCs as well as semi-volatile organic compounds (SVOCs) – together covering compounds from with two carbon atoms (C2) up to at least 44 carbon atoms (C44) – formaldehyde (CH2O), nitrous oxide (N₂O), sulphur dioxide (SO2) and many others. Therefore, both the breadth of compounds measured and the speciation challenges are solved. Furthermore, the measurements can be highly sensitive, picking up very low concentrations, which may be critical for highly toxic species. The chromatogram below illustrates the large number of distinct compounds that are present in a typical exhaust, with the height of the peaks generally indicating relative amounts.
When deployed together with a traditional PEMS unit, with its capability for measuring total exhaust flow, the concentrations of VOCs can be turned into mass values. Combined with the GPS speed data, the distance-specific emission rates can be calculated, giving mg/km figures as is the basis for regulating most gaseous emissions.
The limitation of this approach is that the sample collection on tubes is cumulative over the test cycle and, therefore, there is no second-by-second signal. This creates two problems. First, when the average concentrations are multiplied by the total exhaust flow, the result is biased due to the highly variable nature of both the target gas concentration and exhaust flow at the instantaneous level. Second, the result is a combined value for the whole test cycle, without any breakdown between different driving modes.
Our approach addresses both limitations. The sample bias issue is overcome using a proprietary on-board constant volume sampling and proportional flow dilution system. To give a breakdown of the combined cycle into useful sub-sections, a geofencing system automatically switches between different sample tubes to sample, for example, urban, rural and motorway driving separately.

A notable advantage of the sample tube approach, from a practical and analytical point of view, is that it separates sample collection from sample analysis. This reduces the complexity of the vehicle test itself, which improves the success rate. Having the sample captured on a tube means that it can be analysed later, in batches for efficiency, and each sample can be analysed multiple times, which is useful for validation and uncertainty analysis. For the purposes of our tests, we use a two-dimensional gas chromatography (GCxGC) system coupled with a time-of-flight mass spectrometer (TOF-MS) from SepSolve Analytical and Markes International. The GCxGC achieves a separation of the hundreds of compounds that would not be possible in a one-dimensional system. The TOF-MS is crucial for identification of the compounds, as well as quantification, which is aided by other detectors such as a FID and electron capture detector (ECD) for N₂O.
Putting these techniques into practice, Emissions Analytics tested eight recent gasoline vehicles in Europe. All were 2020 or 2021 model years, with four standard internal combustion engines, two mild hybrids, one full hybrid and one plug-in hybrid – drawn from eight different brands. All were tested on the standard EQUA Index test cycle set out in previous newsletters and the basis of all data in the Emissions Analytics’ subscription database. While similar to a certification Real Driving Emissions (RDE) test, it has a wider range of dynamic driving and is about twice as long.
The N₂O results are set out in the table below, split between urban, rural and motorway driving. In each case the highest and lowest emitting cars are highlighted. Greatest emissions were seen in rural driving, with urban driving the lowest.

Emissions of N₂O are potentially important as the gas is a much more powerful greenhouse gas than carbon dioxide (CO2). Over a 100-year horizon, it has warming potential 265 times greater2. Therefore, small amounts of N₂O could undermine the extensive efforts to reduce primary CO2 from engines. On average, across the eight vehicles and three driving modes, the N₂O emissions were 2.1 mg/km. Converted to an equivalent CO2 this is just above half a gram. Real-world CO2 emissions of these test vehicles averaged 142 g/km. Therefore, these N₂O emissions were equivalent to well below 1% of total CO2 – within the measurement error of the CO2 value.
Formaldehyde is a pollutant of concern as it is believed to be carcinogenic and causes a wide range of irritation in humans, including to skin, eyes and lungs. The results from the same eight vehicles are shown below.

Again, highest emissions were seen in rural driving. Although the exact human health effects depend on factors such as the dilution and dispersion of the emissions, it can be seen from the data that there is about a factor of four difference between the cleanest and dirtiest cars.
Turning to other VOCs and SVOCs, the tubes captured over 500 different compounds from each vehicle. Some of these were common to most or all, but other compounds were characteristic of specific vehicles. Taken together, each vehicle has its own chemical signature. The table below shows the top compounds that were common to each vehicle, together with their toxic effects. It should be noted that the actual effects on humans depend on the concentrations experienced.

By way of contrast, the differentiating compounds are shown below. The compound listed is the most abundant chemical with particular prevalence in that vehicle.

On this first pass, therefore, there is good reason to move beyond the simple measure of total hydrocarbons and non-methane hydrocarbons in various regulations around the world. The next stages are to consider the absolute quantities of the compounds, model their dispersion in the environment, understand their toxic effects, and study their propensity to create secondary organic aerosols, i.e. solid airborne particles created as the SVOCs react in the atmosphere.
These initial results demonstrate the capability to identify and measure a wide range of VOCs and SVOCs in real-world driving – compounds that can have a wide range of deleterious effects on human health and the environment. The N₂O results may call into question the priority of adding this pollutant to the new Euro 7 regulation as the effects on global warming may be insignificant and come at the price of higher priced cars with the added regulatory burden. Better to focus on the ongoing effects of VOCs, whether the direct effect on humans and the biosphere, as precursor to ozone and smog, or as they lead to formation of airborne particles matter – which we will look at in a later newsletter.